One private workspace

Your entire trading desk

One place for

  • Option trading
  • Stock trading
  • Screeners
  • Backtesting
  • ML Lab
Option tradingRead an option before you place it and follow it afterwards. Figures come from market data and a pricing model.
Stock tradingPlace and close orders from a chart. Accounts start on paper, with simulated money.
ScreenersSort the market by rules you can read. Each result shows the measure that put it on the list.
BacktestingReplay a rule over price history to see what would have happened. It describes the past.
ML LabBuild a model in steps, then test it on data it has never seen. No coding needed.
EarningsThe earnings calendar, and each company's reported results over past quarters.
Global ConsoleWorld markets on one map: sessions, indexes, commodities and the day's headlines.
Smart MoneyTrades that members of Congress disclose, and the holdings large funds report, in one place.

Your desk
is waiting

One workspace, many tools

Charts, screeners, an options journal, a profit and loss calendar, backtests and a library sit side by side on one desk, so the day is spent reading the market and not switching windows.

Botertrade

Trading
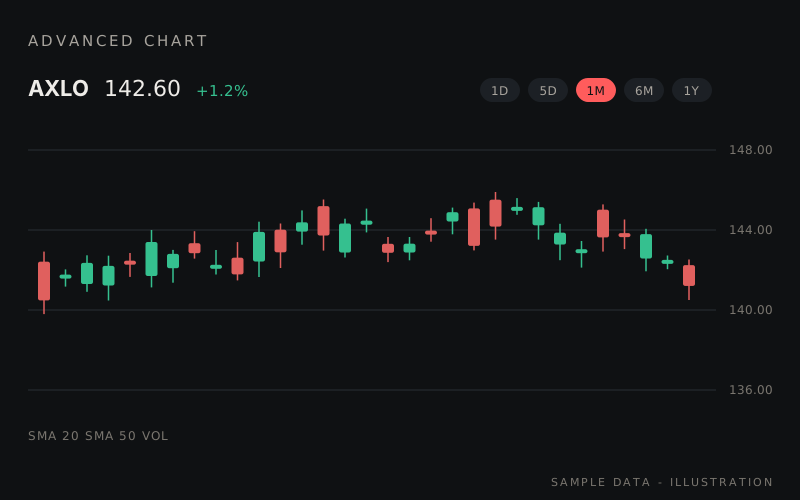
Advanced Chart, an illustration
Advanced ChartCandles, timeframes and indicators on a full-size chart.
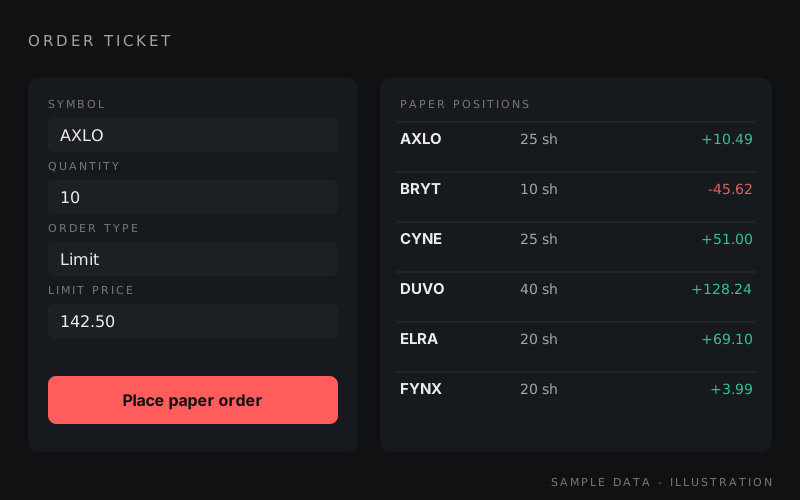
Order ticket, an illustration
Order ticketStock and option orders from one board, on paper first.
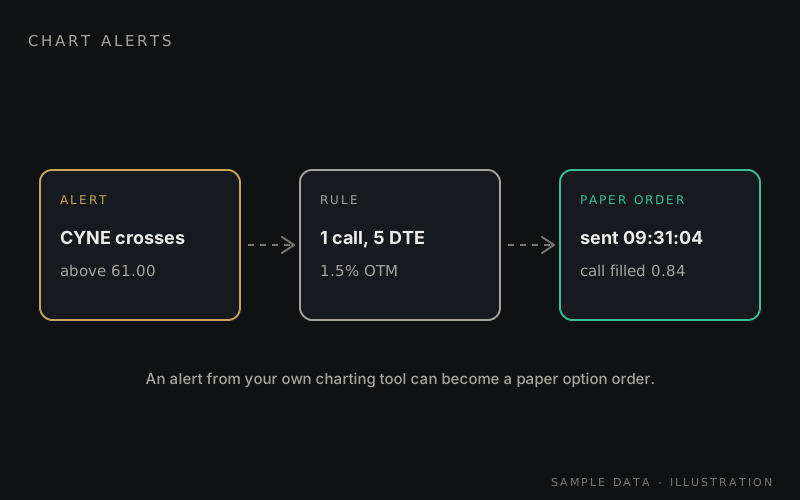
Chart alerts, an illustration
Chart alertsAlerts from your charting tool can become paper option orders.

Strategy Trading

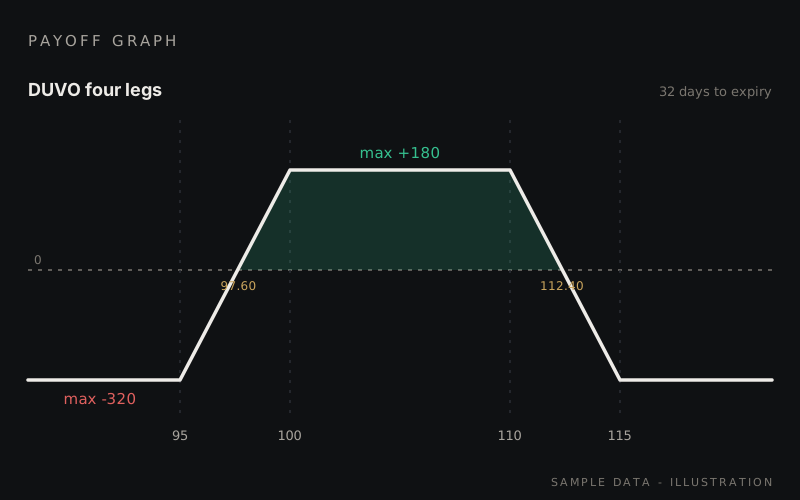
Payoff graph, an illustration
Payoff graphWhat a position pays at expiry, drawn before it is placed.
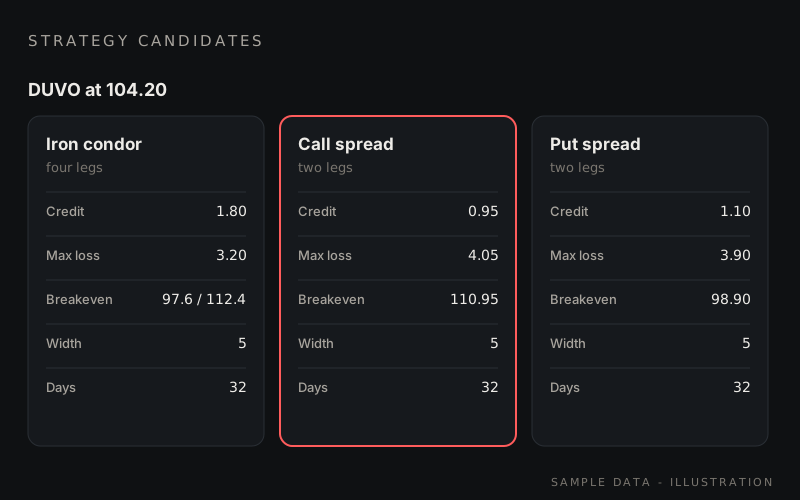
Strategy candidates, an illustration
Strategy candidatesMulti-leg structures listed side by side for one stock.
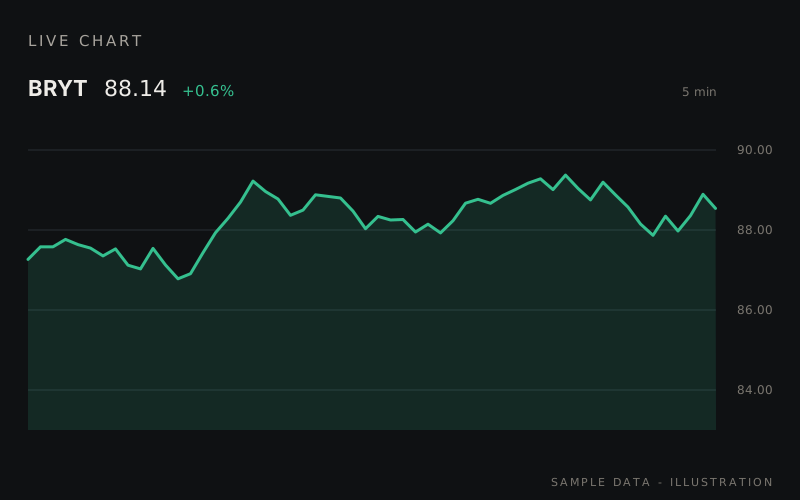
Live chart, an illustration
Live chartThe stock's chart beside the desk, on the same screen.
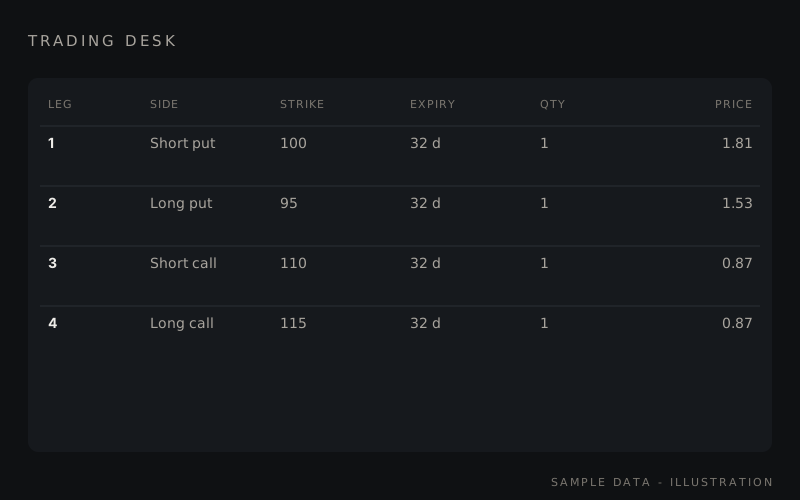
Trading desk, an illustration
Trading deskEvery leg of a position in one table.

Options

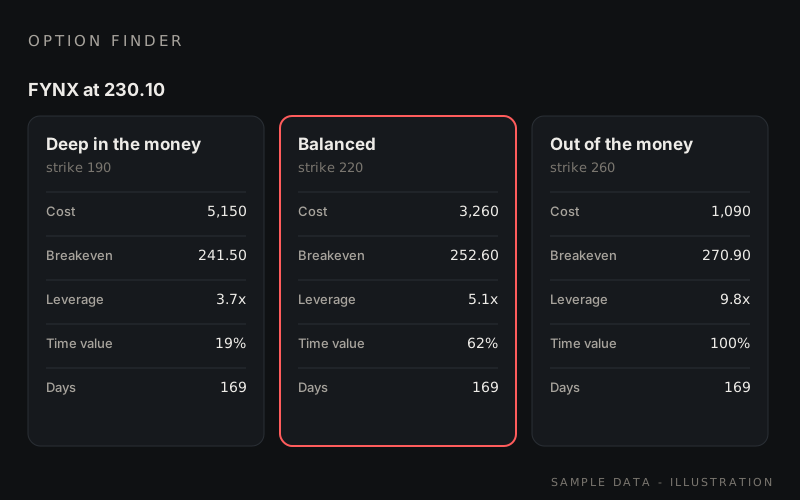
Option Finder, an illustration
Option FinderContracts on one stock with cost, breakeven and leverage.
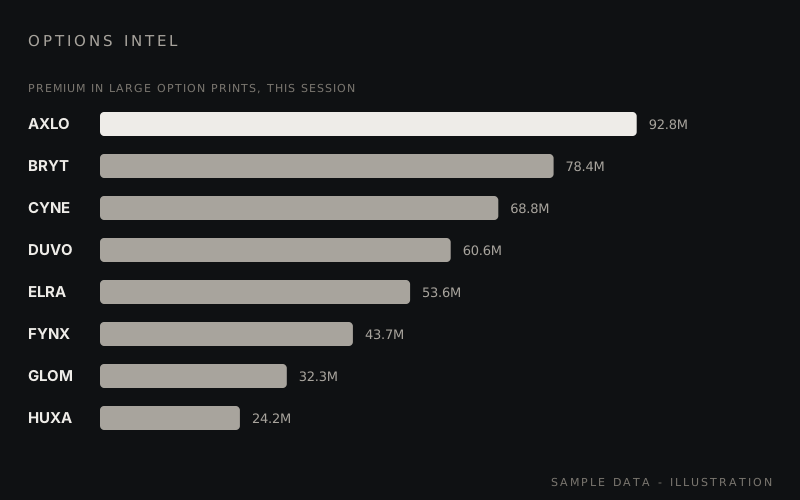
Options Intel, an illustration
Options IntelThe session's largest option activity, name by name.
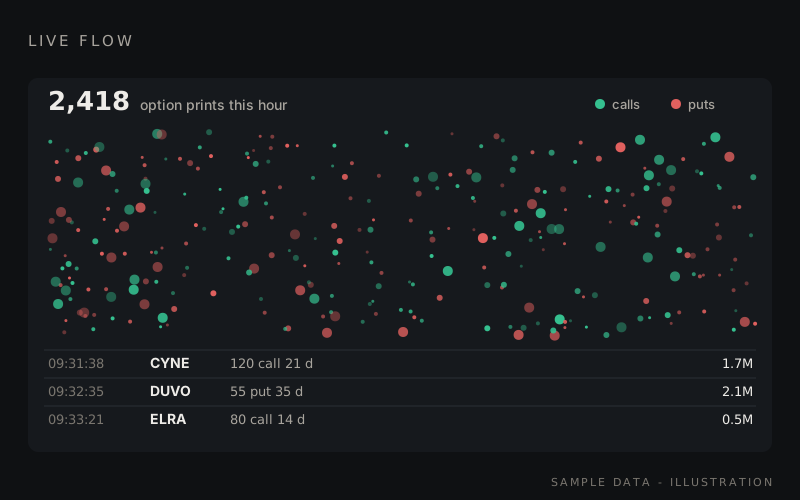
Live flow, an illustration
Live flowOption prints as they are reported.
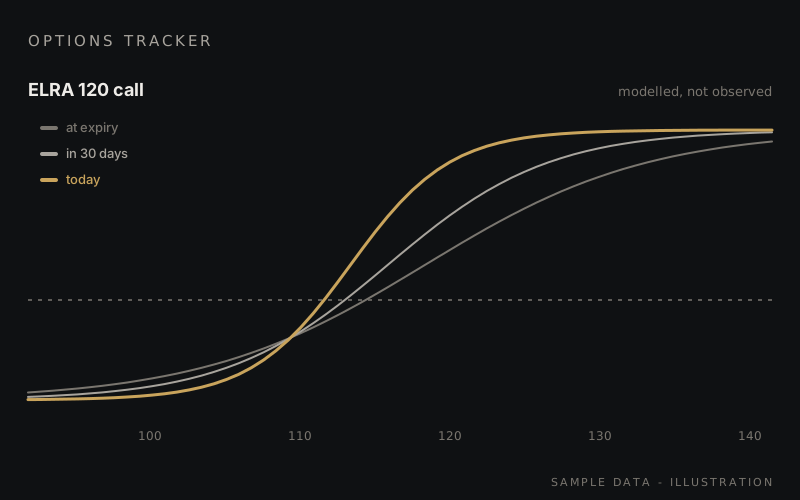
Options Tracker, an illustration
Options TrackerA position modelled across price and time.

Screeners

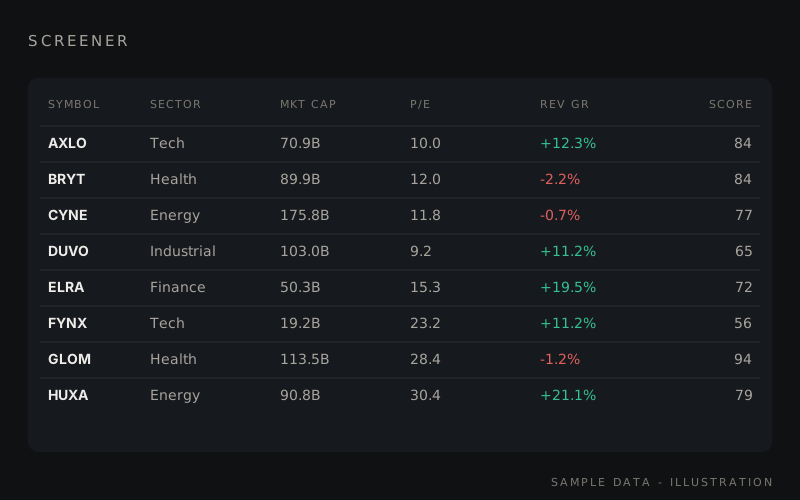
Screener, an illustration
ScreenerStocks filtered by the measures you choose.
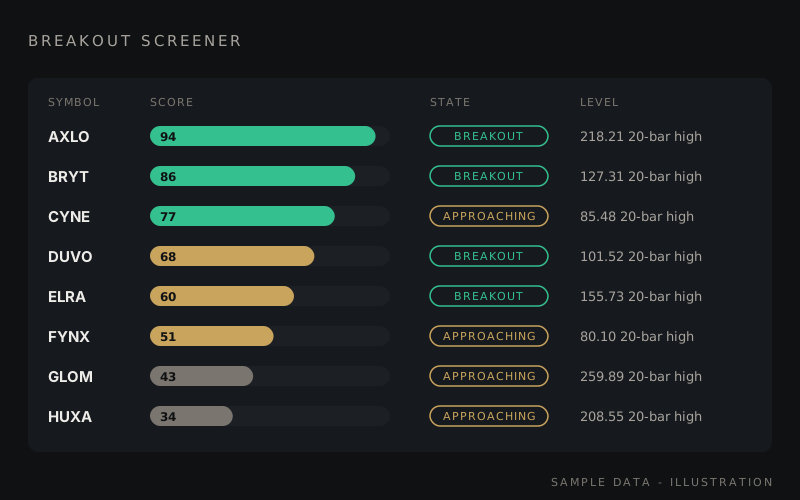
Breakout Screener, an illustration
Breakout ScreenerA score, a state and the level being tested.
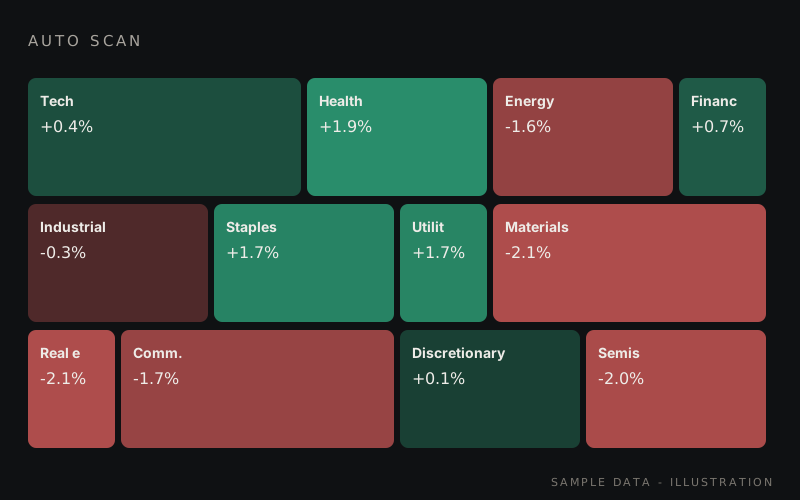
Auto Scan, an illustration
Auto ScanA sector map of the day's scan.
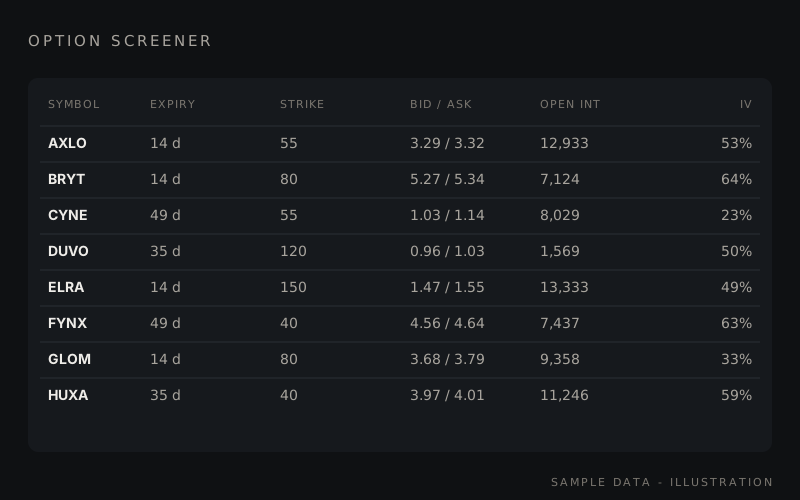
Option Screener, an illustration
Option ScreenerOption contracts filtered across many names.

Backtesting

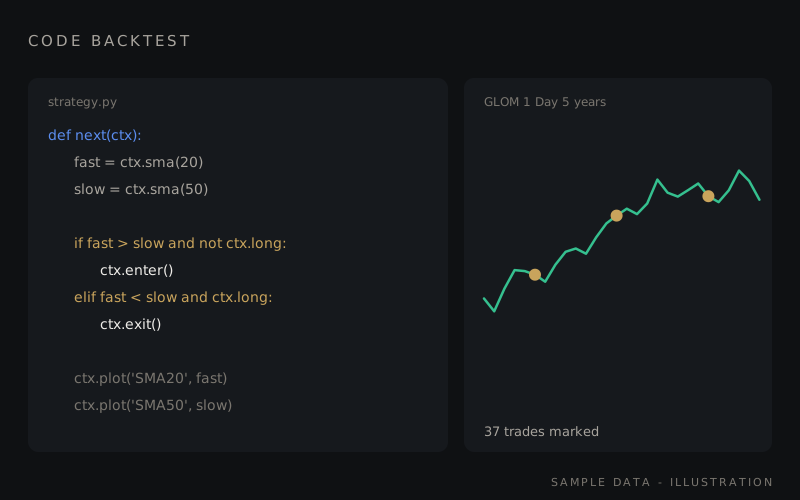
Code Backtest, an illustration
Code BacktestA rule written as code, run on real history.
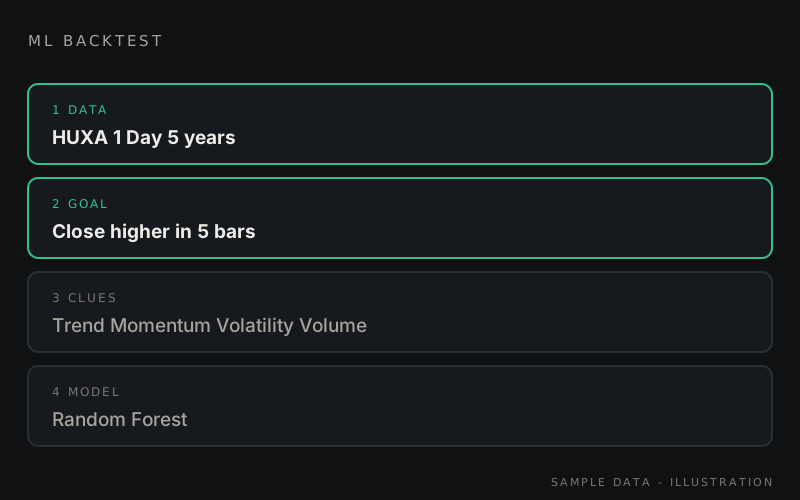
ML Backtest, an illustration
ML BacktestData, goal, clues and model, one step at a time.
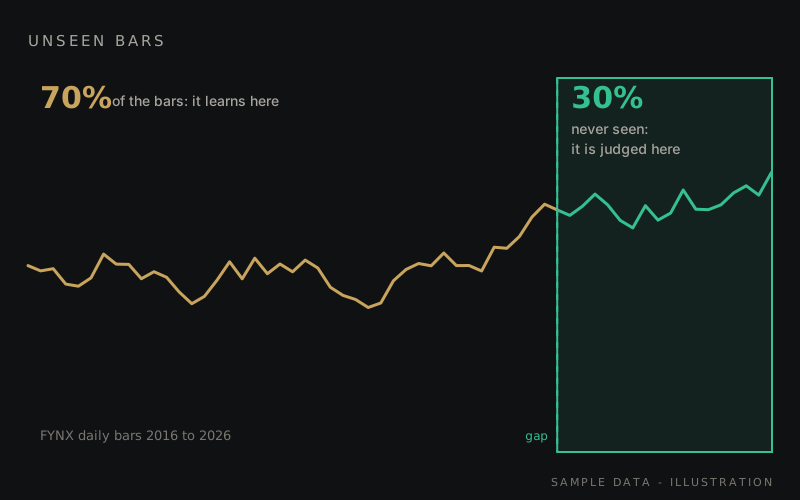
Unseen bars, an illustration
Unseen barsTrained on the past, judged on bars it never saw.
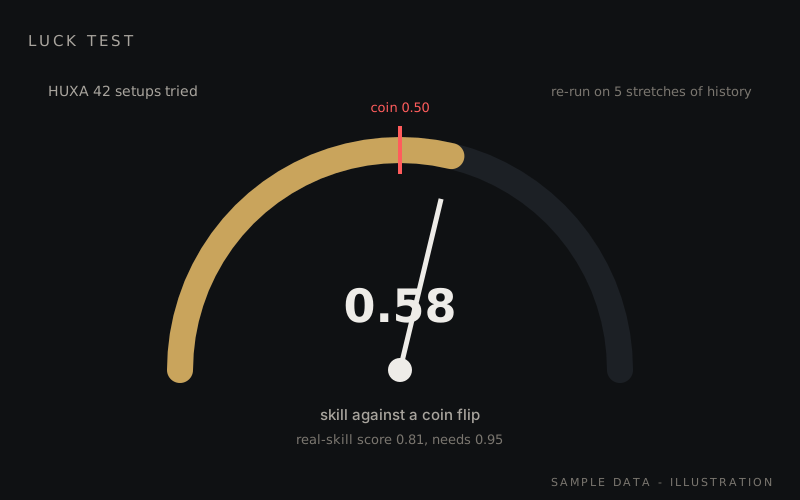
Luck test, an illustration
Luck testA result measured against chance.

Markets

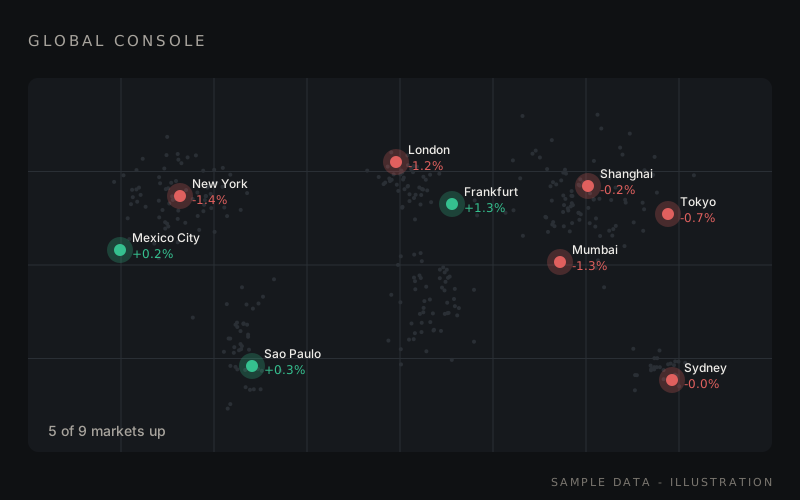
Global Console, an illustration
Global ConsoleWorld markets on one map.
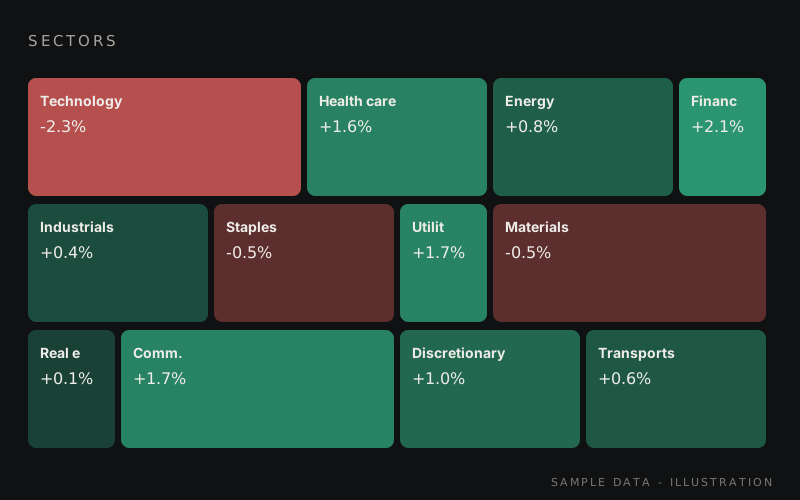
Sectors, an illustration
SectorsThe day's sectors as tiles.
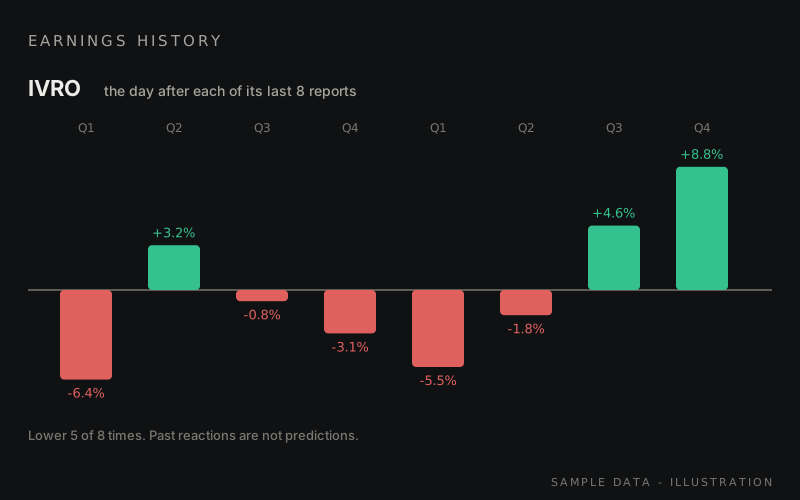
Earnings history, an illustration
Earnings historyHow a stock moved after each of its past reports.
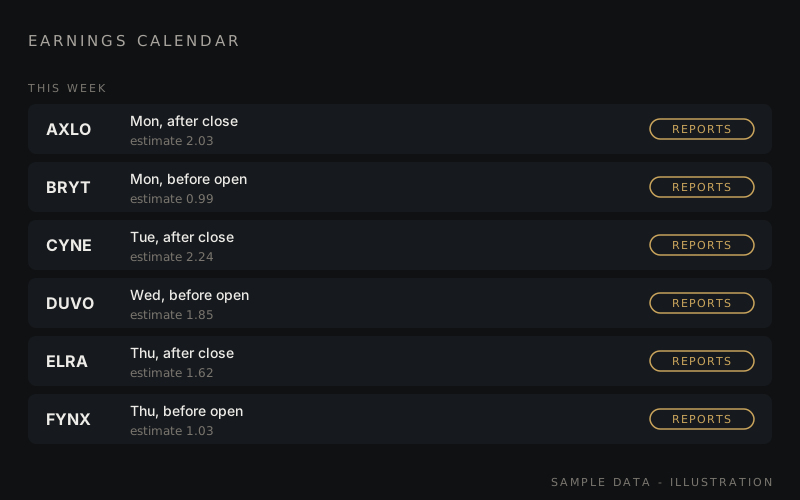
Earnings calendar, an illustration
Earnings calendarWho reports, day by day.

Research

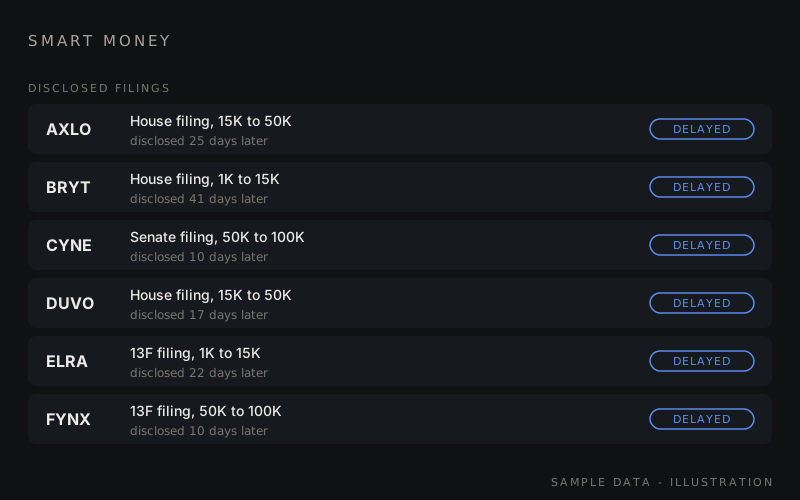
Smart Money, an illustration
Smart MoneyDisclosed, delayed public filings in one panel.
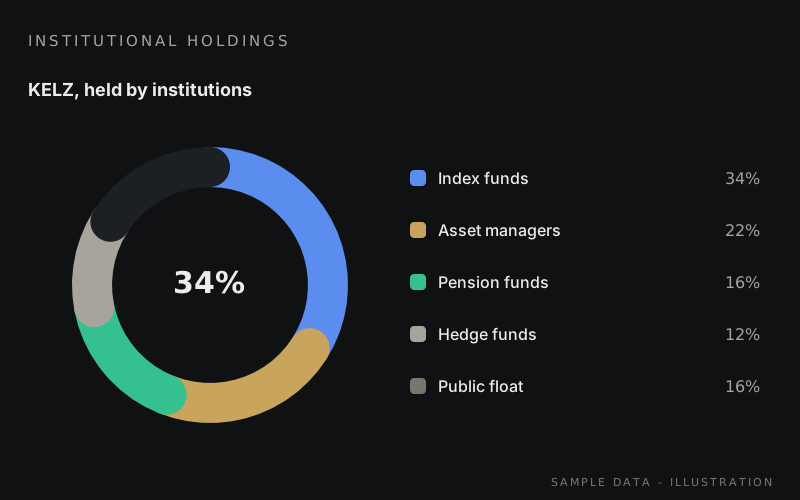
Institutional holdings, an illustration
Institutional holdingsWho holds a company, from quarterly filings.
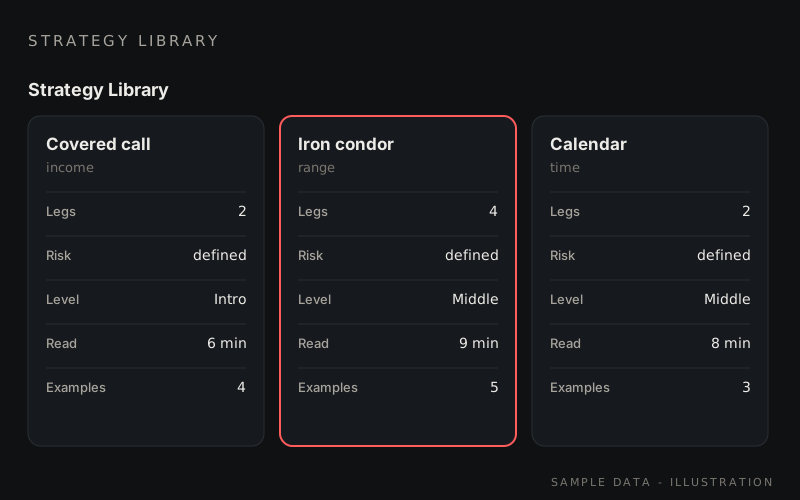
Strategy Library, an illustration
Strategy LibraryWritten explanations of each strategy.

Journals

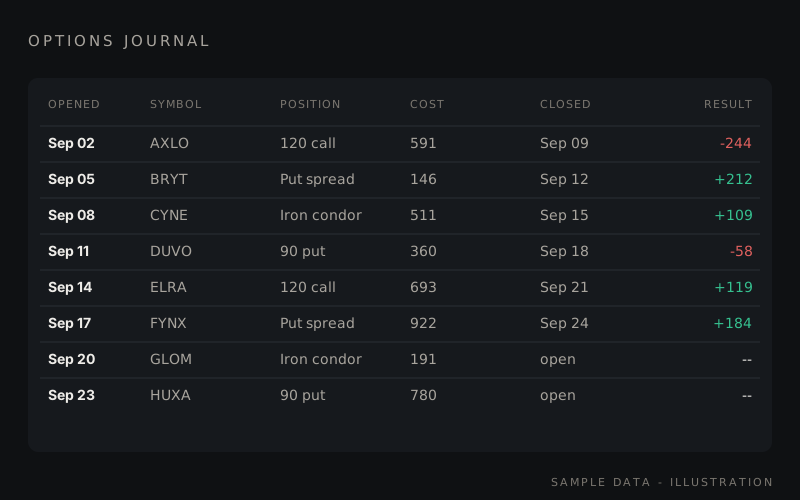
Options Journal, an illustration
Options JournalEach option position from open to close.
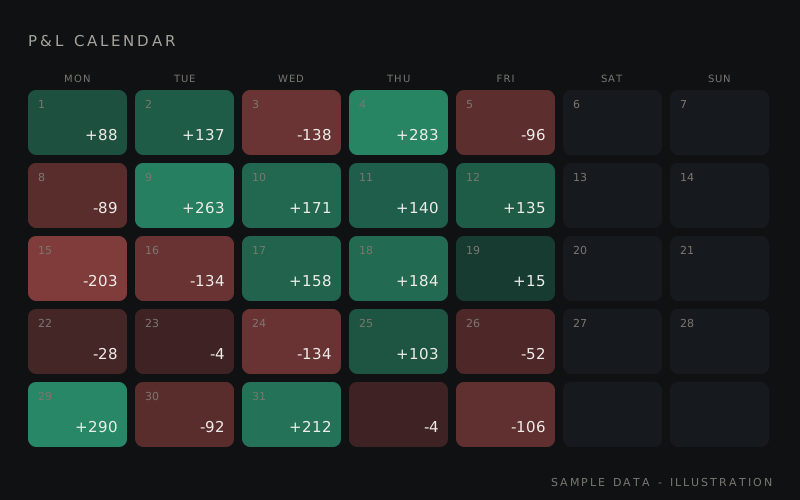
P&L Calendar, an illustration
P&L CalendarProfit and loss by day, as a calendar.
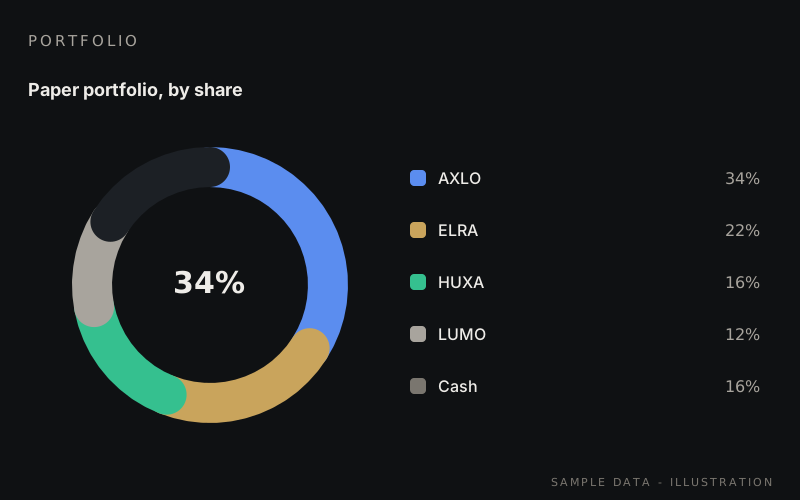
Portfolio, an illustration
PortfolioWhat you hold, by share of the whole.

These pictures are illustrations of the app's screens with sample data: the stock names and figures in them are made up. They are not screenshots and not results. In the app, scores and labels are calculated from historical data and models. They describe what happened; they are not predictions, and nothing is guaranteed.

Everything on the desk

  • Trading
  • Strategy Trading
  • Advanced Chart
  • Option Finder
  • Screener
  • Auto Scan
  • Breakout Scanner
  • Option Screener
  • Code Live Test
  • Global Console
  • Earnings
  • Smart Money
  • Options Journal
  • P&L Calendar
  • Community
  • Library

Trade

  • Trading
  • Strategy Trading
  • Advanced Chart
  • Option Finder

Screen

  • Screener
  • Auto Scan
  • Breakout Scanner
  • Option Screener

Backtest

  • Code Live Test

Markets

  • Global Console
  • Earnings
  • Smart Money

Track

  • Options Journal
  • P&L Calendar

Belong

  • Community
  • Library

Private per account

Kept apart

Each account has its own data store, separate from every other account.

Paper first

Practise with simulated money. Paper screens are labelled as paper.

Descriptive, not advice

The tools describe and teach. Nothing here is a recommendation.
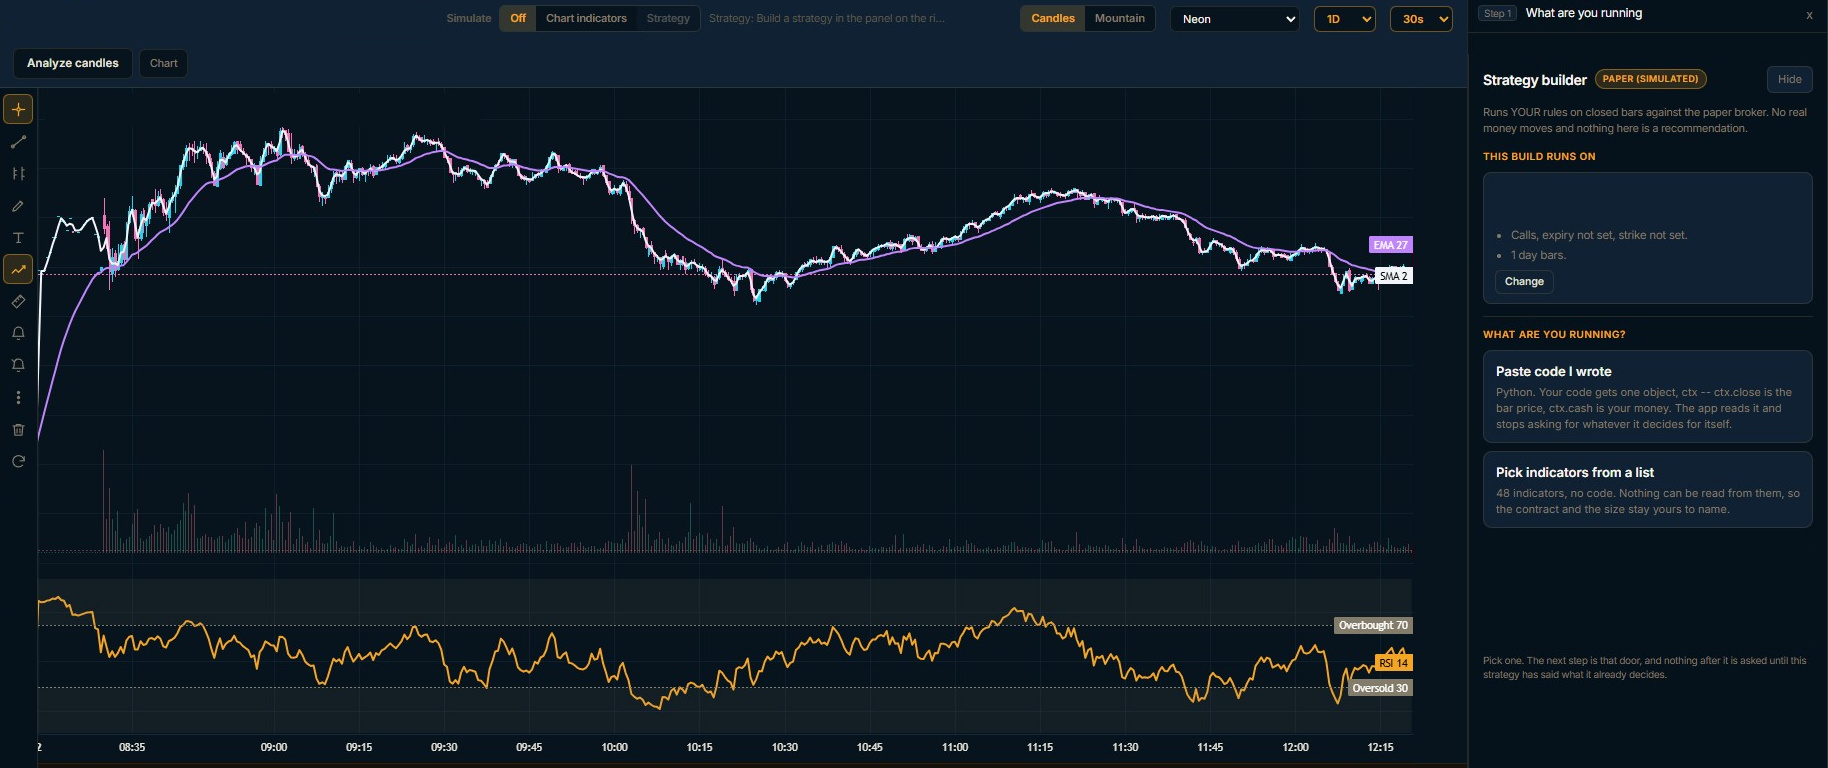
Take the reins

Sign in, and the desk is yours.